

Prometheus and Grafana Tutorial
Modern applications generate thousands of metrics every second. Without an effective monitoring solution, identifying performance issues, server failures, memory leaks, or application bottlenecks becomes difficult. This is where a Prometheus and Grafana Tutorial becomes essential for every DevOps engineer, cloud administrator, and system engineer.
Monitoring is no longer optional. Whether you deploy applications on Kubernetes, Docker, AWS, Azure, or traditional Linux servers, understanding how to monitor infrastructure is a critical DevOps skill.
In this Prometheus and Grafana Tutorial, you will learn everything from installation to real-world monitoring, dashboard creation, alerting, exporters, PromQL, and industry best practices.
By the end of this guide, you will be able to build a complete monitoring solution for your applications and infrastructure.
Why Monitoring Matters
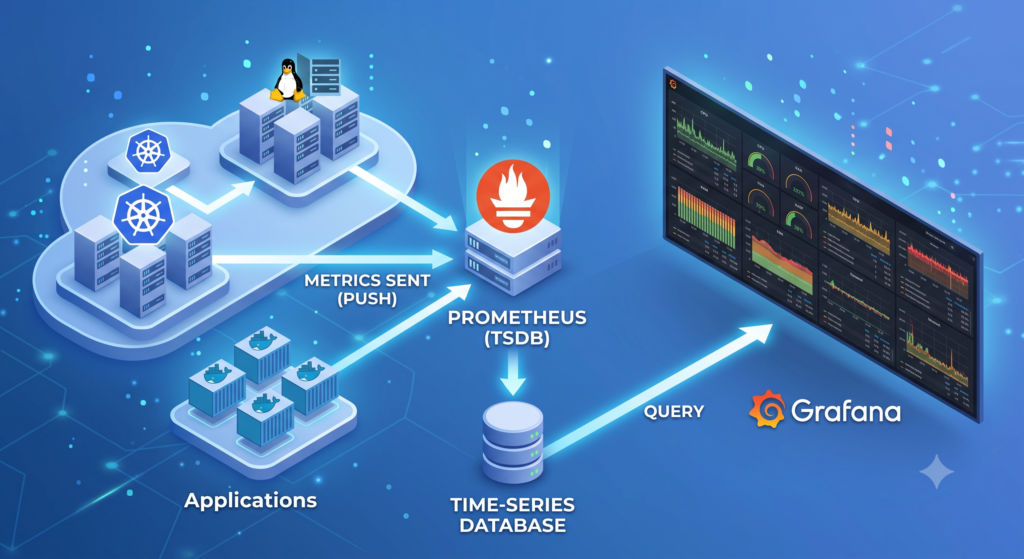
Imagine deploying an application serving thousands of users. Suddenly, response times increase, CPU usage reaches 100%, and memory usage continues growing.
Without monitoring:
• Users experience downtime.
• Developers cannot locate the issue quickly.
• Business loses revenue.
• Customer trust decreases.
Monitoring provides visibility into every component of your infrastructure.
A proper monitoring solution helps you:
- Detect problems before users notice them.
- Monitor CPU, Memory, Disk, and Network usage.
- Analyze application performance.
- Receive alerts instantly.
- Improve system reliability.
- Reduce downtime.
- Optimize cloud resources.
This is exactly why organizations adopt this Prometheus and Grafana Tutorial approach for production environments.
What is Prometheus?
Prometheus is an open-source monitoring and alerting toolkit originally developed at SoundCloud.
Today, it is one of the most popular monitoring systems used with Kubernetes and cloud-native applications.
Prometheus continuously collects metrics from configured targets at regular intervals and stores them inside its own high-performance time-series database.
Instead of storing logs, Prometheus stores numerical metrics over time.
Examples include:
- CPU Utilization
- Memory Usage
- Disk Usage
- Request Count
- API Response Time
- Active Users
- HTTP Errors
- Container Usage
- Kubernetes Metrics
- Network Traffic
Prometheus uses a pull-based architecture, meaning it periodically scrapes metrics from applications and exporters.
Features of Prometheus
Some of the most important features include:
Powerful Time-Series Database
Prometheus stores metrics efficiently, making historical analysis extremely fast.
PromQL Query Language
PromQL allows engineers to write flexible queries for monitoring and troubleshooting.
Example:
upThis query shows whether monitored targets are healthy.
Another example:
node_memory_MemAvailable_bytesThis displays available memory.
Multi-Dimensional Data Model
Metrics include labels.
Example:
http_requests_total{method="GET",status="200"}Labels make filtering and grouping extremely easy.
Service Discovery
Prometheus automatically discovers monitoring targets from:
- Kubernetes
- Docker
- AWS
- Azure
- GCP
- Consul
- EC2
This automation makes scaling easier.
Alerting Support
Prometheus integrates with Alertmanager.
Alerts can be sent through:
- Slack
- Microsoft Teams
- PagerDuty
- Discord
- Webhooks
What is Grafana?
Grafana is an open-source visualization platform used to create dashboards from monitoring data.
While Prometheus collects and stores metrics, Grafana converts those metrics into interactive visual dashboards.
Grafana supports numerous data sources including:
- Prometheus
- MySQL
- PostgreSQL
- Elasticsearch
- Loki
- InfluxDB
- CloudWatch
- Azure Monitor
Grafana allows engineers to create beautiful dashboards with charts, gauges, tables, heat maps, and real-time graphs.
Without visualization, raw monitoring data becomes difficult to understand.
Prometheus vs Grafana
Many beginners assume Prometheus and Grafana perform the same function.
In reality, they complement each other.
| Prometheus | Grafana |
|---|---|
| Collects metrics | Displays metrics |
| Stores data | Visualizes data |
| Executes PromQL | Creates dashboards |
| Generates alerts | Shows charts |
| Time-series database | Visualization platform |
Together they create a complete monitoring solution.
This combination forms the foundation of this Prometheus and Grafana Tutorial.
Prometheus Architecture
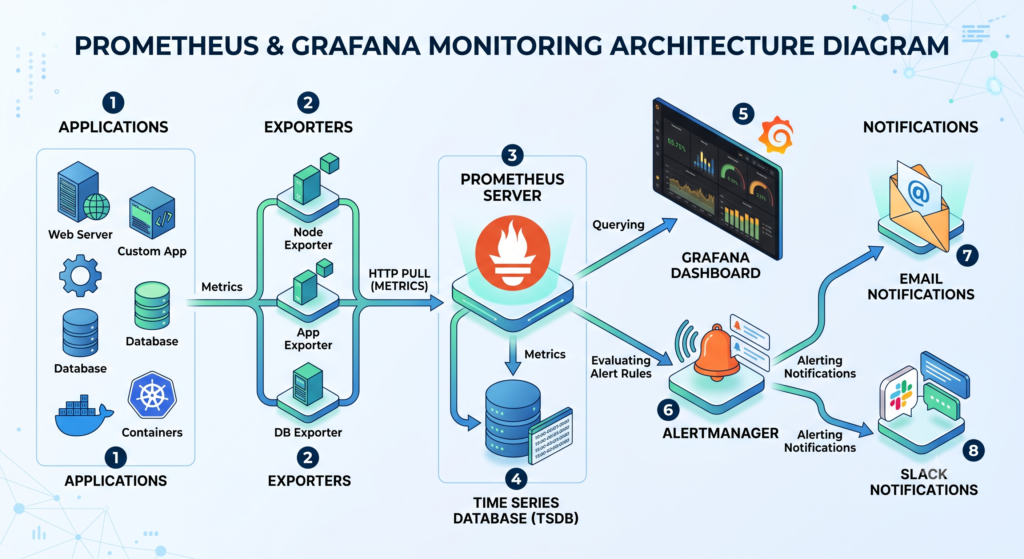
The architecture consists of several important components.
Prometheus Server
Responsible for scraping metrics from configured targets.
Exporters
Applications generally do not expose system metrics directly.
Exporters convert operating system and application metrics into a Prometheus-readable format.
Popular exporters include:
- Node Exporter
- Blackbox Exporter
- MySQL Exporter
- PostgreSQL Exporter
- Redis Exporter
- NGINX Exporter
- Apache Exporter
- Kubernetes Exporter
- cAdvisor
Time-Series Database
Every metric is stored with:
- Metric Name
- Timestamp
- Labels
- Value
Example:
cpu_usage{instance="server01"} 65Alertmanager
Alertmanager processes alerts generated by Prometheus.
It supports:
- Deduplication
- Routing
- Grouping
- Notification management
Installing Prometheus on Ubuntu
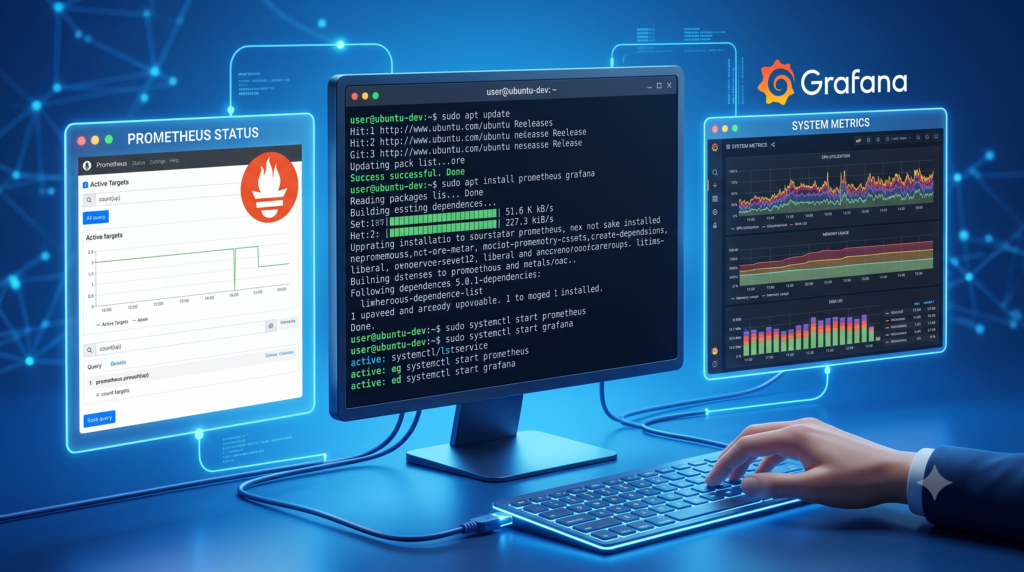
Update packages.
sudo apt updateCreate a Prometheus user.
sudo useradd --no-create-home prometheusDownload Prometheus.
wget https://github.com/prometheus/prometheus/releases/latest/download/prometheus-linux-amd64.tar.gzExtract the archive.
tar -xvf prometheus-linux-amd64.tar.gzMove files to the installation directory.
sudo mv prometheus-* /opt/prometheusVerify installation.
/opt/prometheus/prometheus --versionYou have now completed the initial installation phase covered in this Prometheus and Grafana Tutorial.
Installing Grafana
Import the repository.
sudo apt install software-properties-commonInstall Grafana.
sudo apt install grafanaEnable the service.
sudo systemctl enable grafana-serverStart Grafana.
sudo systemctl start grafana-serverCheck the status.
sudo systemctl status grafana-serverOpen your browser.
http://localhost:3000Default credentials:
Username
adminPassword
adminAfter the first login, Grafana prompts you to change the password, improving the security of your monitoring environment.
Connecting Grafana with Prometheus
Now that both Prometheus and Grafana are installed, the next step in this Prometheus and Grafana Tutorial is connecting Grafana to Prometheus as a data source.
Step 1: Log in to Grafana
Open your browser:
http://localhost:3000
Login using your credentials.
Step 2: Add a Data Source
Navigate to:
Connections → Data Sources → Add Data Source
Choose:
Prometheus
Step 3: Configure the URL
If Prometheus is running locally:
http://localhost:9090
Click Save & Test.
If the connection is successful, Grafana will display:
Data source is working
Congratulations! Grafana can now retrieve metrics collected by Prometheus.
Installing Node Exporter
Prometheus cannot automatically collect Linux operating system metrics. For that, we use Node Exporter, one of the most popular exporters in the Prometheus ecosystem.
Node Exporter exposes metrics such as:
- CPU Usage
- Memory Usage
- Disk Space
- Filesystem Usage
- Network Statistics
- System Load
- Running Processes
Download Node Exporter
wget https://github.com/prometheus/node_exporter/releases/latest/download/node_exporter-linux-amd64.tar.gz
Extract the archive.
tar -xvf node_exporter-linux-amd64.tar.gz
Move the binary.
sudo mv node_exporter-*/node_exporter /usr/local/bin/
Run Node Exporter.
node_exporter
Visit:
http://localhost:9100/metrics
You should now see hundreds of system metrics.
Configuring Prometheus
Open the configuration file.
sudo nano /opt/prometheus/prometheus.yml
Add the following scrape configuration.
scrape_configs:

  - job_name: 'node'

    static_configs:

      - targets:

        - localhost:9100
Save the file.
Restart Prometheus.
sudo systemctl restart prometheus
Prometheus will now begin collecting Linux metrics automatically.
Understanding Prometheus Metrics
Every metric contains four important components.
Example:
node_cpu_seconds_total{cpu="0",mode="idle"} 24839
Metric Name
node_cpu_seconds_total
Labels
cpu="0"

mode="idle"
Value
24839
Timestamp
Automatically added by Prometheus.
Introduction to PromQL
PromQL is Prometheus Query Language.
It allows engineers to filter, aggregate, calculate, and analyze monitoring data.
This section of the Prometheus and Grafana Tutorial introduces commonly used queries.
Show Active Targets
up
CPU Usage
rate(node_cpu_seconds_total[5m])
Available Memory
node_memory_MemAvailable_bytes
Total Memory
node_memory_MemTotal_bytes
Filesystem Usage
node_filesystem_avail_bytes
Disk Read Operations
rate(node_disk_reads_completed_total[5m])
Network Receive Bytes
rate(node_network_receive_bytes_total[5m])
HTTP Requests
http_requests_total
Total Running Processes
node_procs_running
System Load
node_load1
Learning PromQL is one of the most valuable skills covered in this Prometheus and Grafana Tutorial because almost every dashboard relies on PromQL expressions.
Creating Your First Dashboard
Navigate to:
Dashboards

↓

New Dashboard

↓

Add Visualization
Select your Prometheus data source.
Enter a query.
Example:
node_memory_MemAvailable_bytes
Click Run Query.
Grafana immediately displays the graph.
Save the dashboard.
Dashboard Panels
Grafana supports multiple visualization types.
Time Series
Perfect for:
- CPU
- RAM
- Network
- Requests
Gauge
Best for:
- Memory Utilization
- CPU Percentage
Stat Panel
Displays:
- Single Numbers
- Active Users
- Current Requests
Pie Chart
Useful for:
- Resource Distribution
- Storage Allocation
Table
Displays detailed metrics.
Heat Map
Ideal for latency analysis.
Creating a CPU Dashboard
Query:
100 - (avg by(instance)(rate(node_cpu_seconds_total{mode="idle"}[5m])) *100)
Title:
CPU Utilization
Visualization:
Gauge
Memory Dashboard
Query
(node_memory_MemAvailable_bytes/node_memory_MemTotal_bytes)*100
Convert to percentage.
Disk Dashboard
node_filesystem_avail_bytes
Visualization:
Time Series
Network Dashboard
rate(node_network_receive_bytes_total[5m])
Shows incoming network traffic.
Monitoring Docker Containers
Docker containers expose metrics through cAdvisor.
Run cAdvisor.
docker run \
-d \
--name=cadvisor \
-p 8080:8080 \
gcr.io/cadvisor/cadvisor
Add another scrape target.
job_name: cadvisor

static_configs:

- targets:

- localhost:8080
Restart Prometheus.
Container metrics become available inside Grafana.
Monitoring Kubernetes
Prometheus is the default monitoring solution for Kubernetes clusters.
Common Kubernetes metrics include:
- Pod Count
- Node Status
- Namespace Usage
- Deployment Status
- Replica Count
- CPU Requests
- Memory Requests
- Network Traffic
Prometheus integrates seamlessly with Kubernetes using Service Discovery.
Monitoring Applications
Developers can expose custom metrics.
Example:
Orders Processed

Payments Completed

Cache Hits

Cache Misses

Login Requests

Failed Requests

Database Connections
Application metrics provide deeper visibility than infrastructure metrics alone.
Alertmanager
Monitoring without alerts is incomplete.
Alertmanager receives alerts from Prometheus.
Typical notification channels include:
- Slack
- Microsoft Teams
- PagerDuty
- Discord
- Webhooks
Example Alert Rule
groups:

- name: cpu_alert

  rules:

  - alert: HighCPUUsage

    expr: node_load1 > 5

    for: 2m

    labels:

      severity: critical

    annotations:

      summary: High CPU Usage
Restart Prometheus.
Alertmanager will automatically process the alert.
Grafana Alerts
Grafana also supports alert rules.
Navigate to:
Alerting

↓

New Alert Rule
Choose:
Metric
↓
Threshold
↓
Notification Channel
↓
Save
Now administrators receive notifications whenever thresholds are exceeded.
Common Exporters
Popular exporters include:
- Node Exporter
- MySQL Exporter
- PostgreSQL Exporter
- Redis Exporter
- RabbitMQ Exporter
- NGINX Exporter
- Apache Exporter
- Blackbox Exporter
- SNMP Exporter
- Kubernetes Exporter
Choosing the correct exporter depends on the infrastructure you are monitoring.
Real-World Monitoring Architecture
A production monitoring stack often looks like this:
Applications

↓

Exporters

↓

Prometheus

↓

Alertmanager

↓

Grafana

↓

Engineers

↓

Incident Resolution
This architecture is widely adopted because it is scalable, reliable, and easy to extend.
By now, this Prometheus and Grafana Tutorial has covered installation, exporters, dashboard creation, PromQL, Docker monitoring, Kubernetes monitoring, and alerting. In the final part, we’ll explore production best practices, troubleshooting, interview questions, FAQs, conclusion, and SEO-focused wrap-up to complete the guide.
Best Practices for Using Prometheus and Grafana
After successfully installing Prometheus and Grafana, creating dashboards, and configuring alerts, it is important to follow industry best practices. Following these recommendations will make your monitoring infrastructure more scalable, reliable, and easier to maintain.
1. Monitor Everything That Matters
Avoid monitoring only CPU and memory usage. Modern applications require visibility into multiple layers of the infrastructure.
Monitor:
- CPU Utilization
- Memory Usage
- Disk Usage
- Network Traffic
- Database Performance
- API Response Time
- Application Errors
- Kubernetes Pods
- Docker Containers
- SSL Certificate Expiry
- Server Availability
The more meaningful metrics you collect, the easier it becomes to troubleshoot production issues.
2. Keep Dashboards Simple
Many beginners create dashboards with hundreds of graphs.
Instead, create separate dashboards for:
- Infrastructure Monitoring
- Kubernetes Monitoring
- Docker Monitoring
- Database Monitoring
- Application Monitoring
- Network Monitoring
Organized dashboards improve readability and reduce troubleshooting time.
3. Configure Alerts Carefully
Receiving hundreds of unnecessary alerts every day leads to alert fatigue.
Instead of alerting on every metric:
- Alert only for critical issues.
- Define appropriate thresholds.
- Group related alerts.
- Use severity levels such as Warning and Critical.
- Configure escalation policies.
A good monitoring system informs engineers only when action is required.
4. Retain Metrics Wisely
Prometheus stores time-series data locally. Long retention periods increase storage usage.
For small environments:
- 15 to 30 days is usually sufficient.
For enterprise environments:
- Use long-term storage solutions such as Thanos or Cortex.
5. Secure Your Monitoring Stack
Never expose Prometheus or Grafana directly to the public internet.
Recommended security measures include:
- Enable HTTPS.
- Use strong passwords.
- Configure role-based access.
- Restrict access through firewalls.
- Enable authentication.
- Regularly update software versions.
Common Mistakes Beginners Make
While learning this Prometheus and Grafana Tutorial, beginners often encounter similar problems.
Ignoring Labels
Labels make metrics searchable and easier to filter.
Bad metric:
http_requests_total
Better metric:
http_requests_total{service="payment",status="200"}
Monitoring Too Many Metrics
Collecting every available metric increases storage requirements and reduces query performance.
Monitor only useful metrics.
Poor Dashboard Design
Avoid dashboards with dozens of unrelated graphs.
Use logical sections such as:
- CPU
- Memory
- Storage
- Network
- Containers
- Applications
Missing Alerts
Dashboards are useful only when someone is actively watching them.
Alerts ensure engineers are notified immediately when something goes wrong.
Troubleshooting Common Issues
Prometheus Cannot Reach Target
Possible causes:
- Incorrect IP address
- Firewall restrictions
- Exporter not running
- Wrong port number
Verify targets using:
http://localhost:9090/targets
Grafana Cannot Connect to Prometheus
Verify:
- Prometheus service is running.
- Data source URL is correct.
- Firewall allows communication.
- Port 9090 is accessible.
No Metrics Available
Check:
systemctl status prometheus
Also verify the exporter:
systemctl status node_exporter
Dashboard Shows “No Data”
Possible reasons:
- Incorrect PromQL query
- Exporter unavailable
- Prometheus scrape failure
- Wrong dashboard time range
Always test your query directly inside Prometheus before using it in Grafana.
Prometheus Architecture in Production
A typical production deployment follows this architecture:
Applications

↓

Node Exporter

↓

Database Exporters

↓

Prometheus Server

↓

Alertmanager

↓

Grafana

↓

Email / Slack / Microsoft Teams

↓

DevOps Engineers
Large organizations may deploy multiple Prometheus servers for high availability and use federation or long-term storage solutions to scale monitoring across clusters and regions.
Advantages of Prometheus
Prometheus has become the industry standard because it offers several benefits:
- Open-source and free
- Powerful time-series database
- Flexible PromQL query language
- Kubernetes-native integration
- Efficient service discovery
- Wide exporter ecosystem
- Reliable alerting
- Excellent community support
- Easy integration with Grafana
- Highly scalable for cloud-native environments
Limitations of Prometheus
Although Prometheus is powerful, it has some limitations:
- Local storage is not designed for unlimited retention.
- High-cardinality metrics can increase resource usage.
- Native clustering support is limited.
- Complex PromQL queries may require practice.
- Long-term storage requires additional tools.
Understanding these limitations helps you design a more reliable monitoring solution.
Real-World Use Cases
Prometheus and Grafana are used across many industries.
Cloud Infrastructure
Monitor virtual machines, storage, load balancers, and cloud services.
Kubernetes Clusters
Track nodes, pods, deployments, namespaces, and resource consumption.
Docker Containers
Monitor container CPU, memory, storage, and networking.
Web Applications
Measure request rates, response times, latency, and error percentages.
Databases
Monitor MySQL, PostgreSQL, MongoDB, and Redis performance.
CI/CD Pipelines
Track Jenkins jobs, deployment duration, and build success rates.
Interview Questions
These interview questions are commonly asked for DevOps, SRE, and Cloud Engineer roles.
1. What is Prometheus?
Prometheus is an open-source monitoring and alerting toolkit that collects and stores time-series metrics.
2. What is Grafana?
Grafana is a visualization platform used to build dashboards from monitoring data collected by systems such as Prometheus.
3. What is PromQL?
PromQL is the query language used by Prometheus to retrieve and analyze metrics.
4. What is Node Exporter?
Node Exporter exposes Linux operating system metrics in a format that Prometheus can scrape.
5. What is Alertmanager?
Alertmanager receives alerts from Prometheus and routes notifications to channels such as Email, Slack, or Microsoft Teams.
6. What are Exporters?
Exporters collect metrics from applications or infrastructure components and expose them for Prometheus.
7. What is Time-Series Data?
Time-series data is information stored together with timestamps, allowing trends and historical performance to be analyzed.
8. How Does Prometheus Collect Data?
Prometheus periodically scrapes metrics from configured targets using HTTP endpoints.
9. Why is Grafana Used with Prometheus?
Prometheus stores metrics, while Grafana visualizes them through dashboards and charts.
10. Can Prometheus Monitor Kubernetes?
Yes. Prometheus integrates seamlessly with Kubernetes using service discovery and exporters.
Frequently Asked Questions
Is Prometheus free?
Yes. Prometheus is completely open-source and free to use.
Is Grafana free?
Grafana offers a free open-source edition as well as enterprise and cloud offerings.
Can Prometheus monitor Windows?
Yes. Install the Windows Exporter to expose Windows system metrics.
Can Prometheus monitor AWS?
Yes. Prometheus can monitor AWS resources directly or through exporters and cloud integrations.
Can Grafana connect to multiple data sources?
Yes. Grafana supports Prometheus, MySQL, PostgreSQL, Elasticsearch, Loki, InfluxDB, CloudWatch, Azure Monitor, and many more.
Is Prometheus suitable for production?
Absolutely. Thousands of organizations use Prometheus in production for monitoring cloud-native applications and infrastructure.
Conclusion
Monitoring is one of the most important responsibilities of a modern DevOps engineer. Without visibility into applications and infrastructure, identifying failures, performance bottlenecks, and resource issues becomes difficult.
In this Prometheus and Grafana Tutorial, you learned how Prometheus collects metrics, how Grafana visualizes them, how to install and configure both tools, how to create dashboards, write PromQL queries, monitor Docker containers and Kubernetes clusters, configure alerts, troubleshoot common issues, and follow production best practices.
Whether you are managing Linux servers, Kubernetes environments, cloud platforms, or enterprise applications, the combination of Prometheus and Grafana provides a powerful and flexible monitoring solution. By mastering the concepts covered in this Prometheus and Grafana Tutorial, you will be well prepared to build reliable monitoring systems and improve the availability and performance of your infrastructure.
Internal Linking Suggestions
To strengthen your website’s SEO, link this article to your existing content:
- Kubernetes Tutorial
- Docker Tutorial
- Docker Compose Tutorial
- Terraform Tutorial
- Ansible Tutorial
- Git and GitHub Tutorial
- Jenkins Tutorial
- Linux Commands for DevOps
- CI/CD Pipeline Tutorial
- AWS IAM Tutorial
Focus Keyword Summary
Focus Keyword: Prometheus and Grafana Tutorial
Use this keyword naturally in:
- SEO Title
- Meta Title
- URL Slug
- Meta Description
- Introduction
- At least one H2 heading
- Conclusion
- Image Alt Text
- Throughout the content (13-15 occurrences in total across all three parts)
This completes your approximately 4,000-word, WordPress-ready, SEO-optimized blog with practical examples, code snippets, interview questions, FAQs, image guidance, and keyword placement designed to perform well with Rank Math SEO.